
Search & Browse
After logging in, select a domain-specific Project (database), search and filter papers in the paper list, then open individual papers' Data pages to browse.
2.1 Databases (Projects)
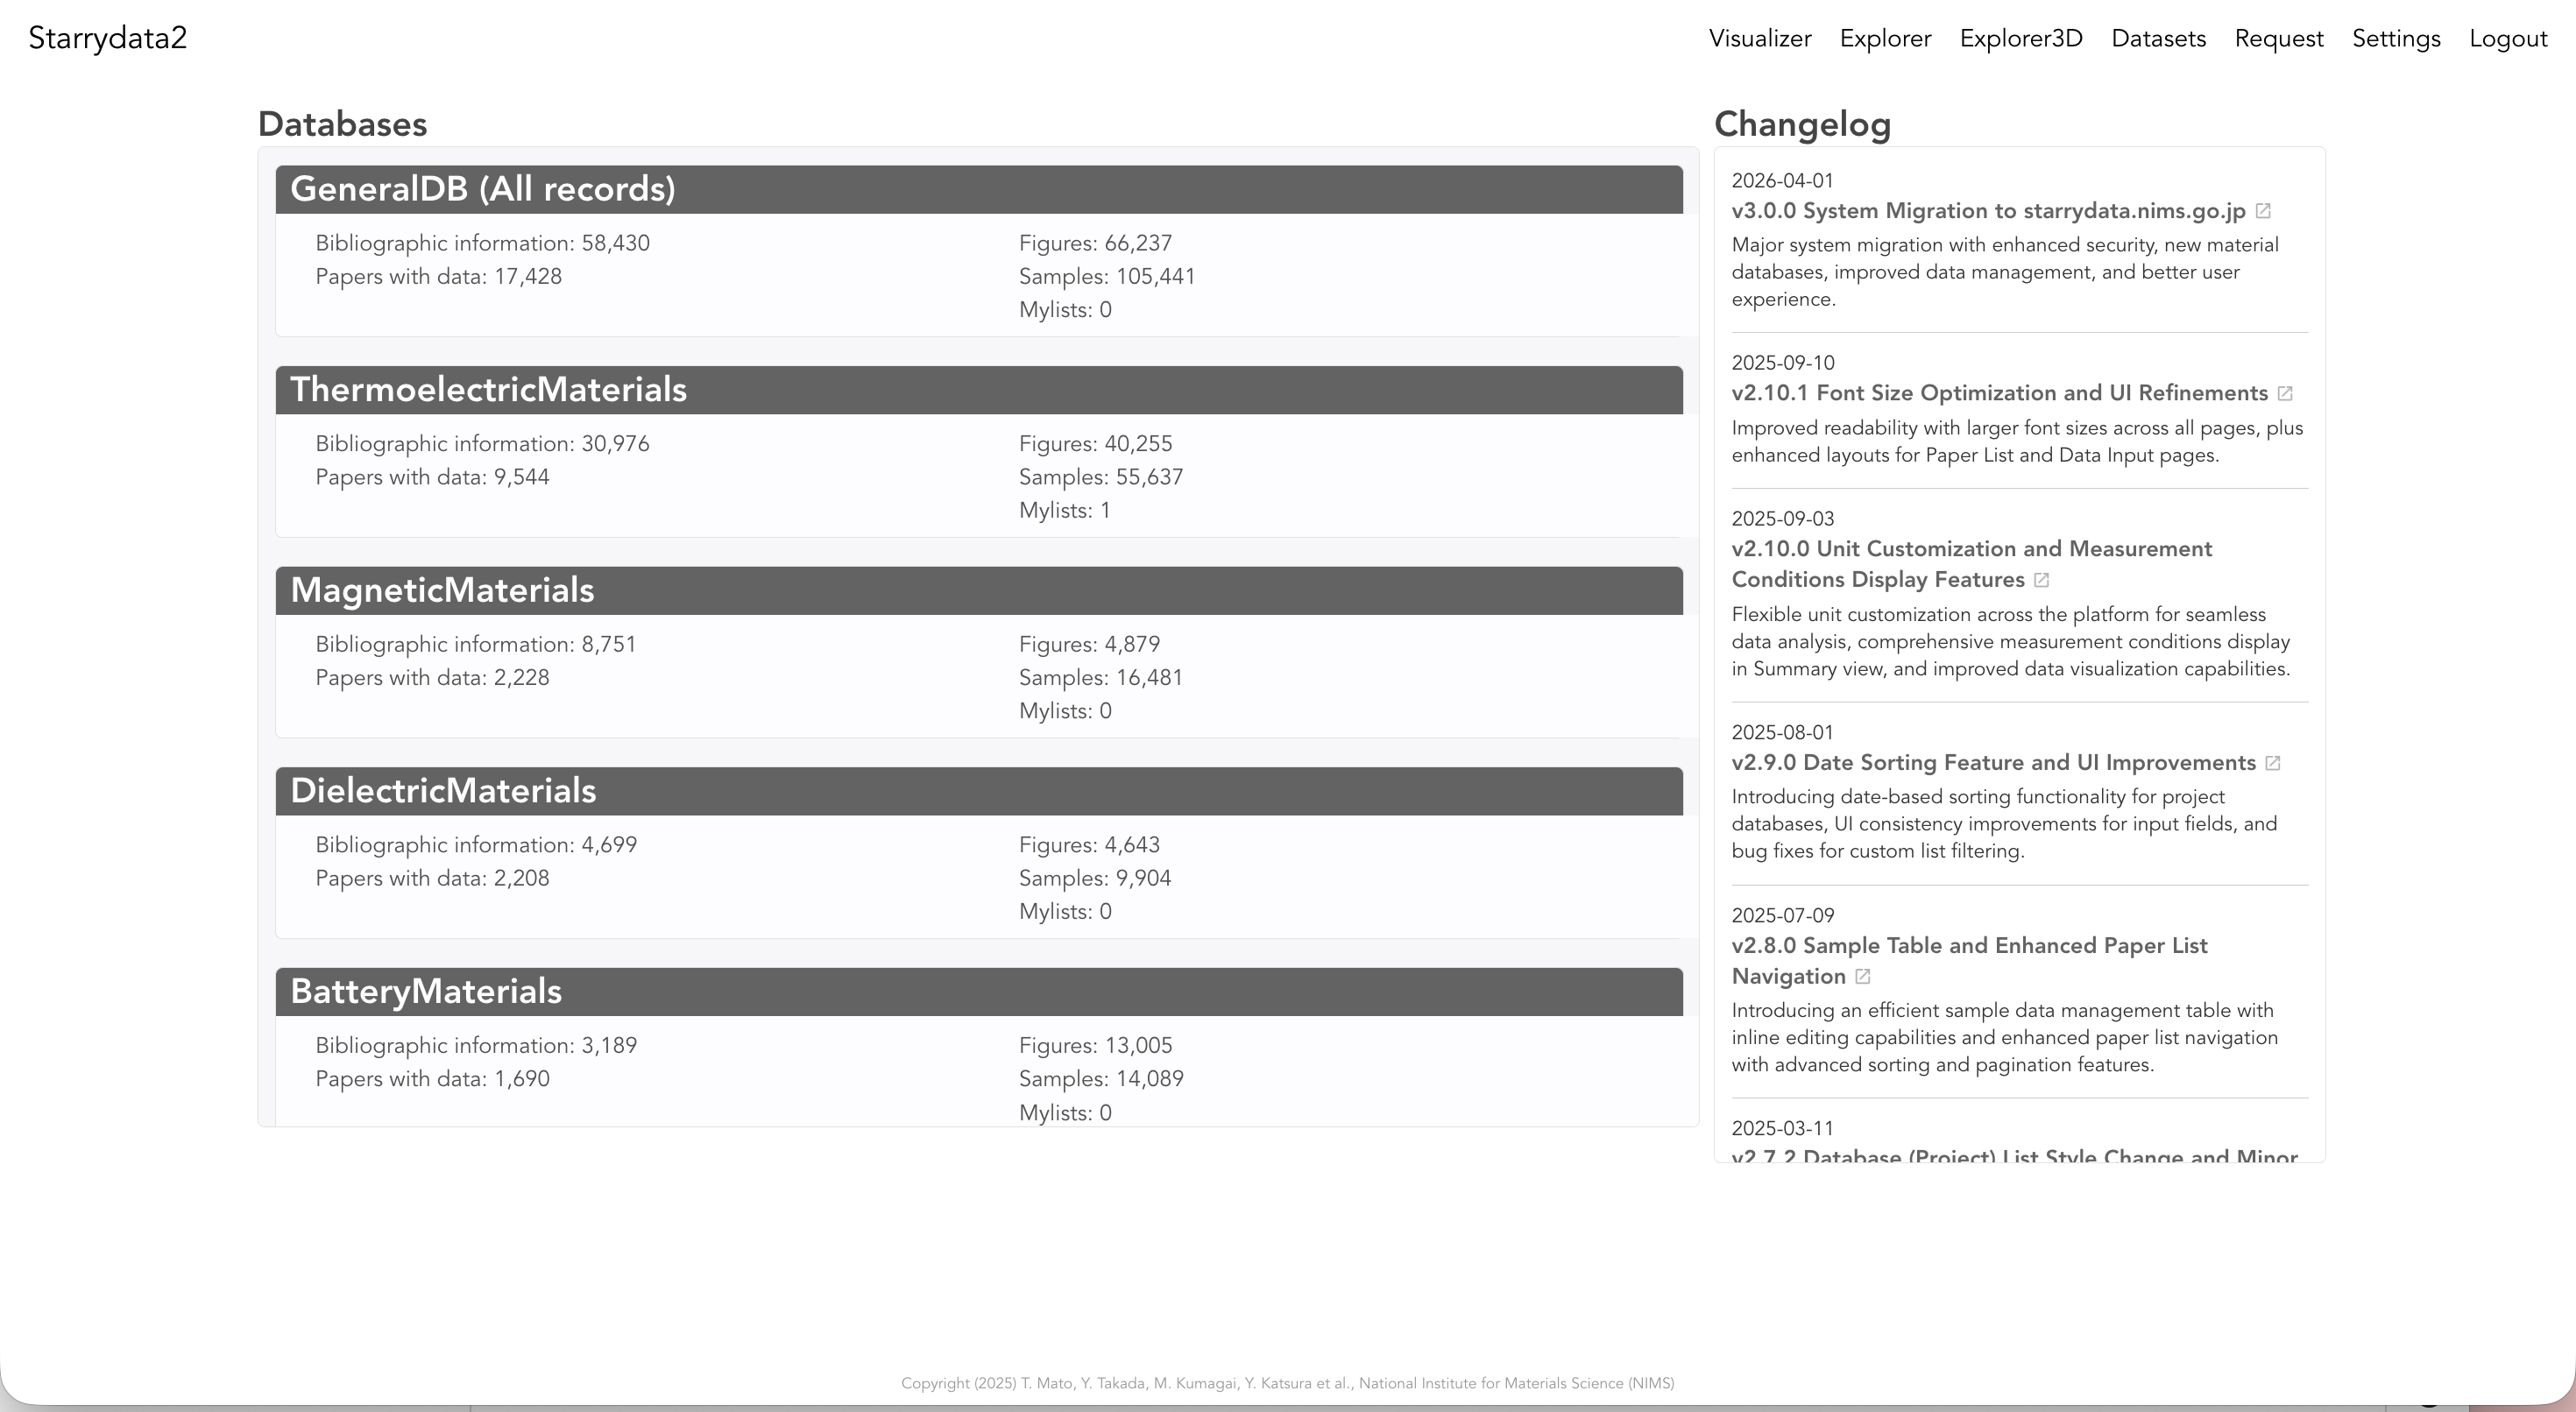
Each project card shows the following counts (numbers are as of the last update):
- Bibliographic information: Number of papers with registered bibliographic information
- Papers with data: Number of papers that have extracted data
- Figures: Number of extracted figures
- Samples: Number of extracted samples
- Mylists: Number of My Lists you have created in that database
GeneralDB for cross-domain searches.
For machine learning or statistical analysis focused on a specific domain, choose the corresponding domain-specific project — it provides domain-specific property templates and paper categories.
2.2 Data hierarchy
Starrydata2 data is organized into three levels plus figure references. The three CSV files (papers / samples / curves) in the official dataset (→ Chapter 4) correspond to this structure.
| Level | Meaning | Identifier |
|---|---|---|
| Paper | A published paper (bibliographic information). A unique SID (Starrydata ID) is assigned to each paper when its DOI is added to the database. | SID |
| Sample | A sample (a set of composition and fabrication process). Multiple samples per paper. | sample_id |
| Figure | A figure number in the paper (e.g., Fig 5a). Referenced by the figure_name field of Curve rows. |
figure_id |
| Curve | One curve representing a single Figure × Sample × property pair (x, y). x and y are arrays. | — |
sample_id = sample ID (many per paper). The "SID" search field refers to the former.
2.3 Paper list page
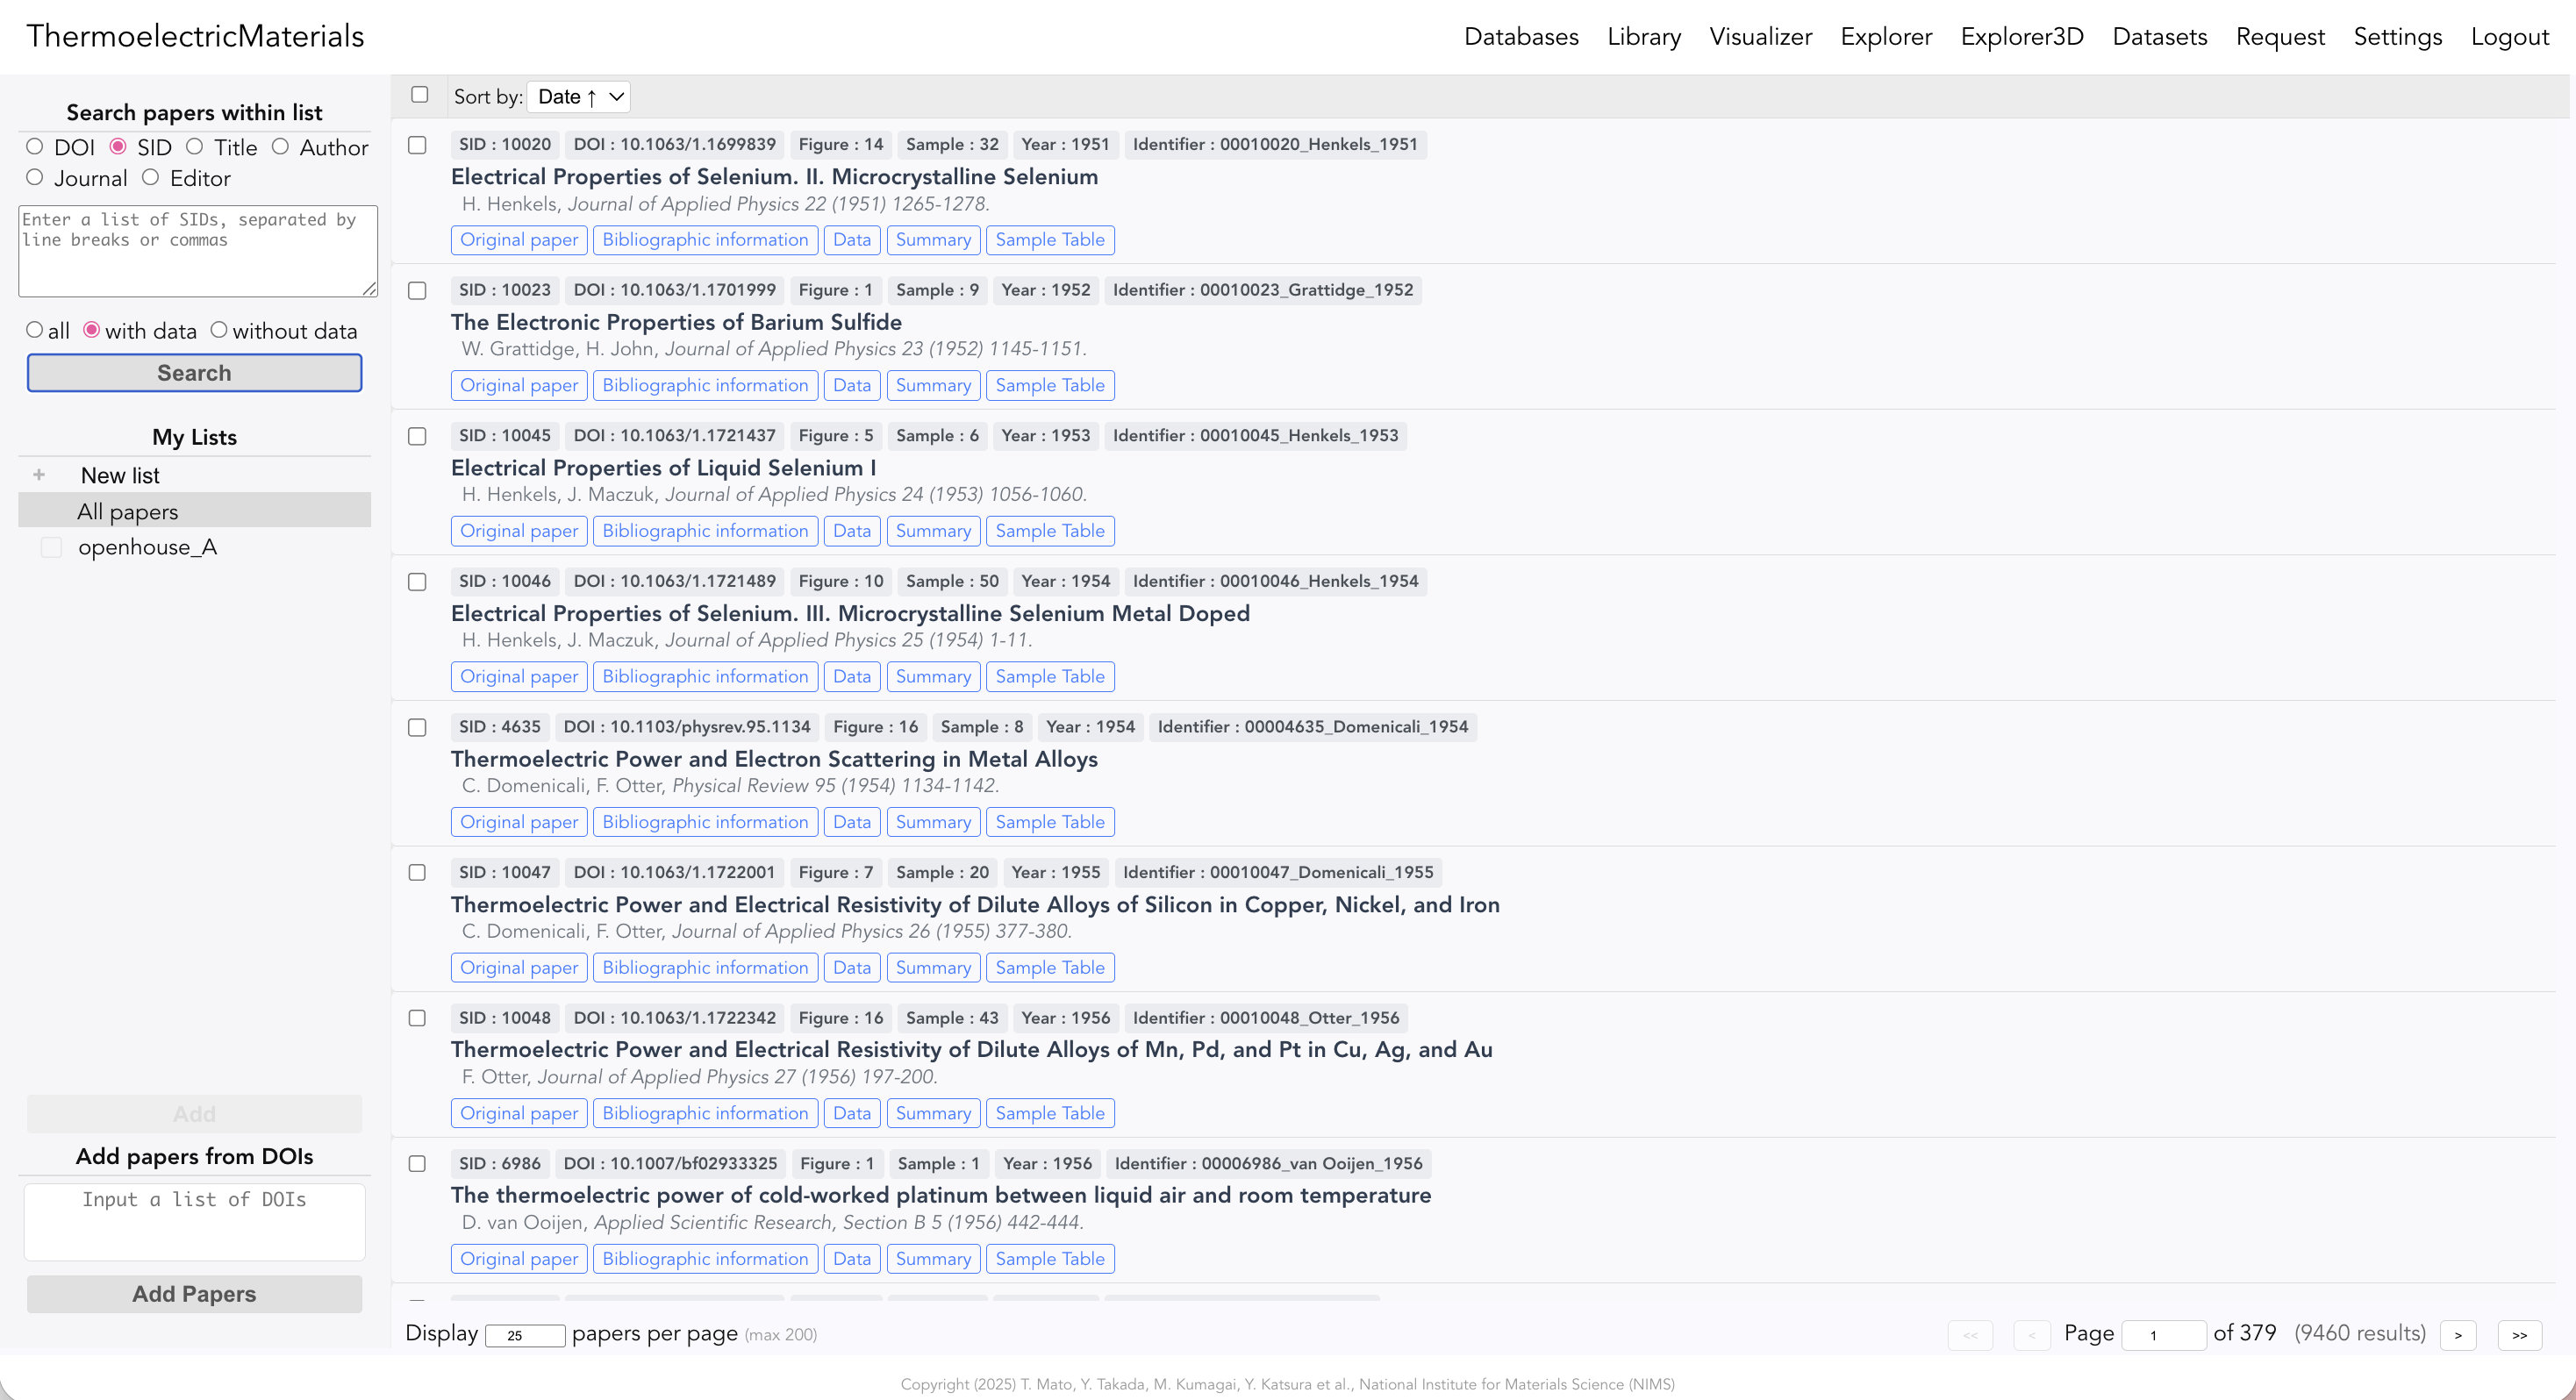
Selecting a Project from Databases takes you to that Project's paper list. Each paper card shows SID / DOI / number of figures / number of samples / year / Editor name, and action links including Bibliographic information, Data, Print, csv, and json.
2.4 Searching for papers
The Search papers within list section in the top of the left sidebar lets you search by the following fields:
- DOI: Full or partial DOI match
- SID: Starrydata ID (a unique ID per paper, assigned when a DOI is added to the database). Distinct from the sample's
sampleid. - Title: String within the title
- Author: Author name
- Journal: Journal name
- Editor: Username of the Curator who registered/edited the paper
Use the radio buttons below to toggle between all / with data / without data to filter to papers with or without extracted data. Click Search to run. Results can be sorted with the Sort by Date toggle (ascending/descending) at the top.
thermoelectric or Bi2Te3). For AND/OR composition searches, we recommend Sample Explorer ↗.
2.5 Results per page and pagination
Results default to 25 per page. You can increase this with the selector at the bottom, but rendering may take a few seconds for 500+ results. Use the pagination controls at the bottom right to navigate pages.
2.6 Reading individual paper / Data pages
Click a paper card's title or the Data link to go to the detail page. Clicking "Data" opens the Data page, where you can see tables of Figures and Samples along with registered axes, values, and visualization plots (→ Chapter 3).
- Bibliographic information: Title, authors, journal, year, DOI (links to publisher's site)
- Editors: Usernames of the Curators who registered/edited this paper
- Figures table: Figure ID / Figure name / Property(x), (y) / Unit(x), (y)
- Samples table: Sample ID / Sample name / Composition
- Plot: Registered curves visualized with Plotly on the right (toggle series visibility in the legend)
2.7 Related visualization tools
In addition to browsing individual data, the following overview tools are accessible from the global navigation:
- Visualizer — Scatter plot browser of property values
- Explorer / Explorer3D — 2D/3D composition exploration combining elements and temperature
- Datasets — Frozen snapshots (→ Chapter 4.5)
- Request — Window for requesting new data or features
Next steps
- Found data you want → Chapter 4: Download
- Want to add your own data → Chapter 3: Data Registration