
Data Registration (Curation)
This chapter explains how to extract curves from figures in published papers using StarryDigitizer, attach composition and fabrication process information, and register the data. Any logged-in user can participate.
3.1 Registration workflow overview
Registration follows these 6 steps:
- Add the paper to a Database / My List (individually or in bulk by DOI)
- Click Data on the paper card to open the Data page
- Enable Edit mode and enter the Figure name and Caption
- Load the original plot image into StarryDigitizer and calibrate the axes
- Create one Dataset per sample, extract points → COPY TO CLIPBOARD
- Paste into XY-value, enter Sample information, property, and units, then click Save
3.2 Adding papers
Adding individually
- Select a My List and use + Add paper or the DOI input field.
- Entering a DOI automatically retrieves bibliographic information (title, authors, journal, volume, year, pages) from CrossRef.
- A unique SID (Starrydata ID) is assigned to that paper at the same time. The paper can be referenced by SID thereafter.
- If there are errors, manually correct them via Bibliographic information on the paper card.
Adding papers in bulk by DOI
- Paste DOIs into the Add papers from DOIs text box in the lower part of the left sidebar, one DOI per line (you can paste directly from an Excel column).
- Click Add Papers. Existing DOIs are simply added to the My List; new DOIs are looked up via CrossRef, registered, and assigned a new SID.
sample_id is a per-sample ID — many are generated within a single paper. The "SID" search field refers to the former.
3.3 Opening the Data page
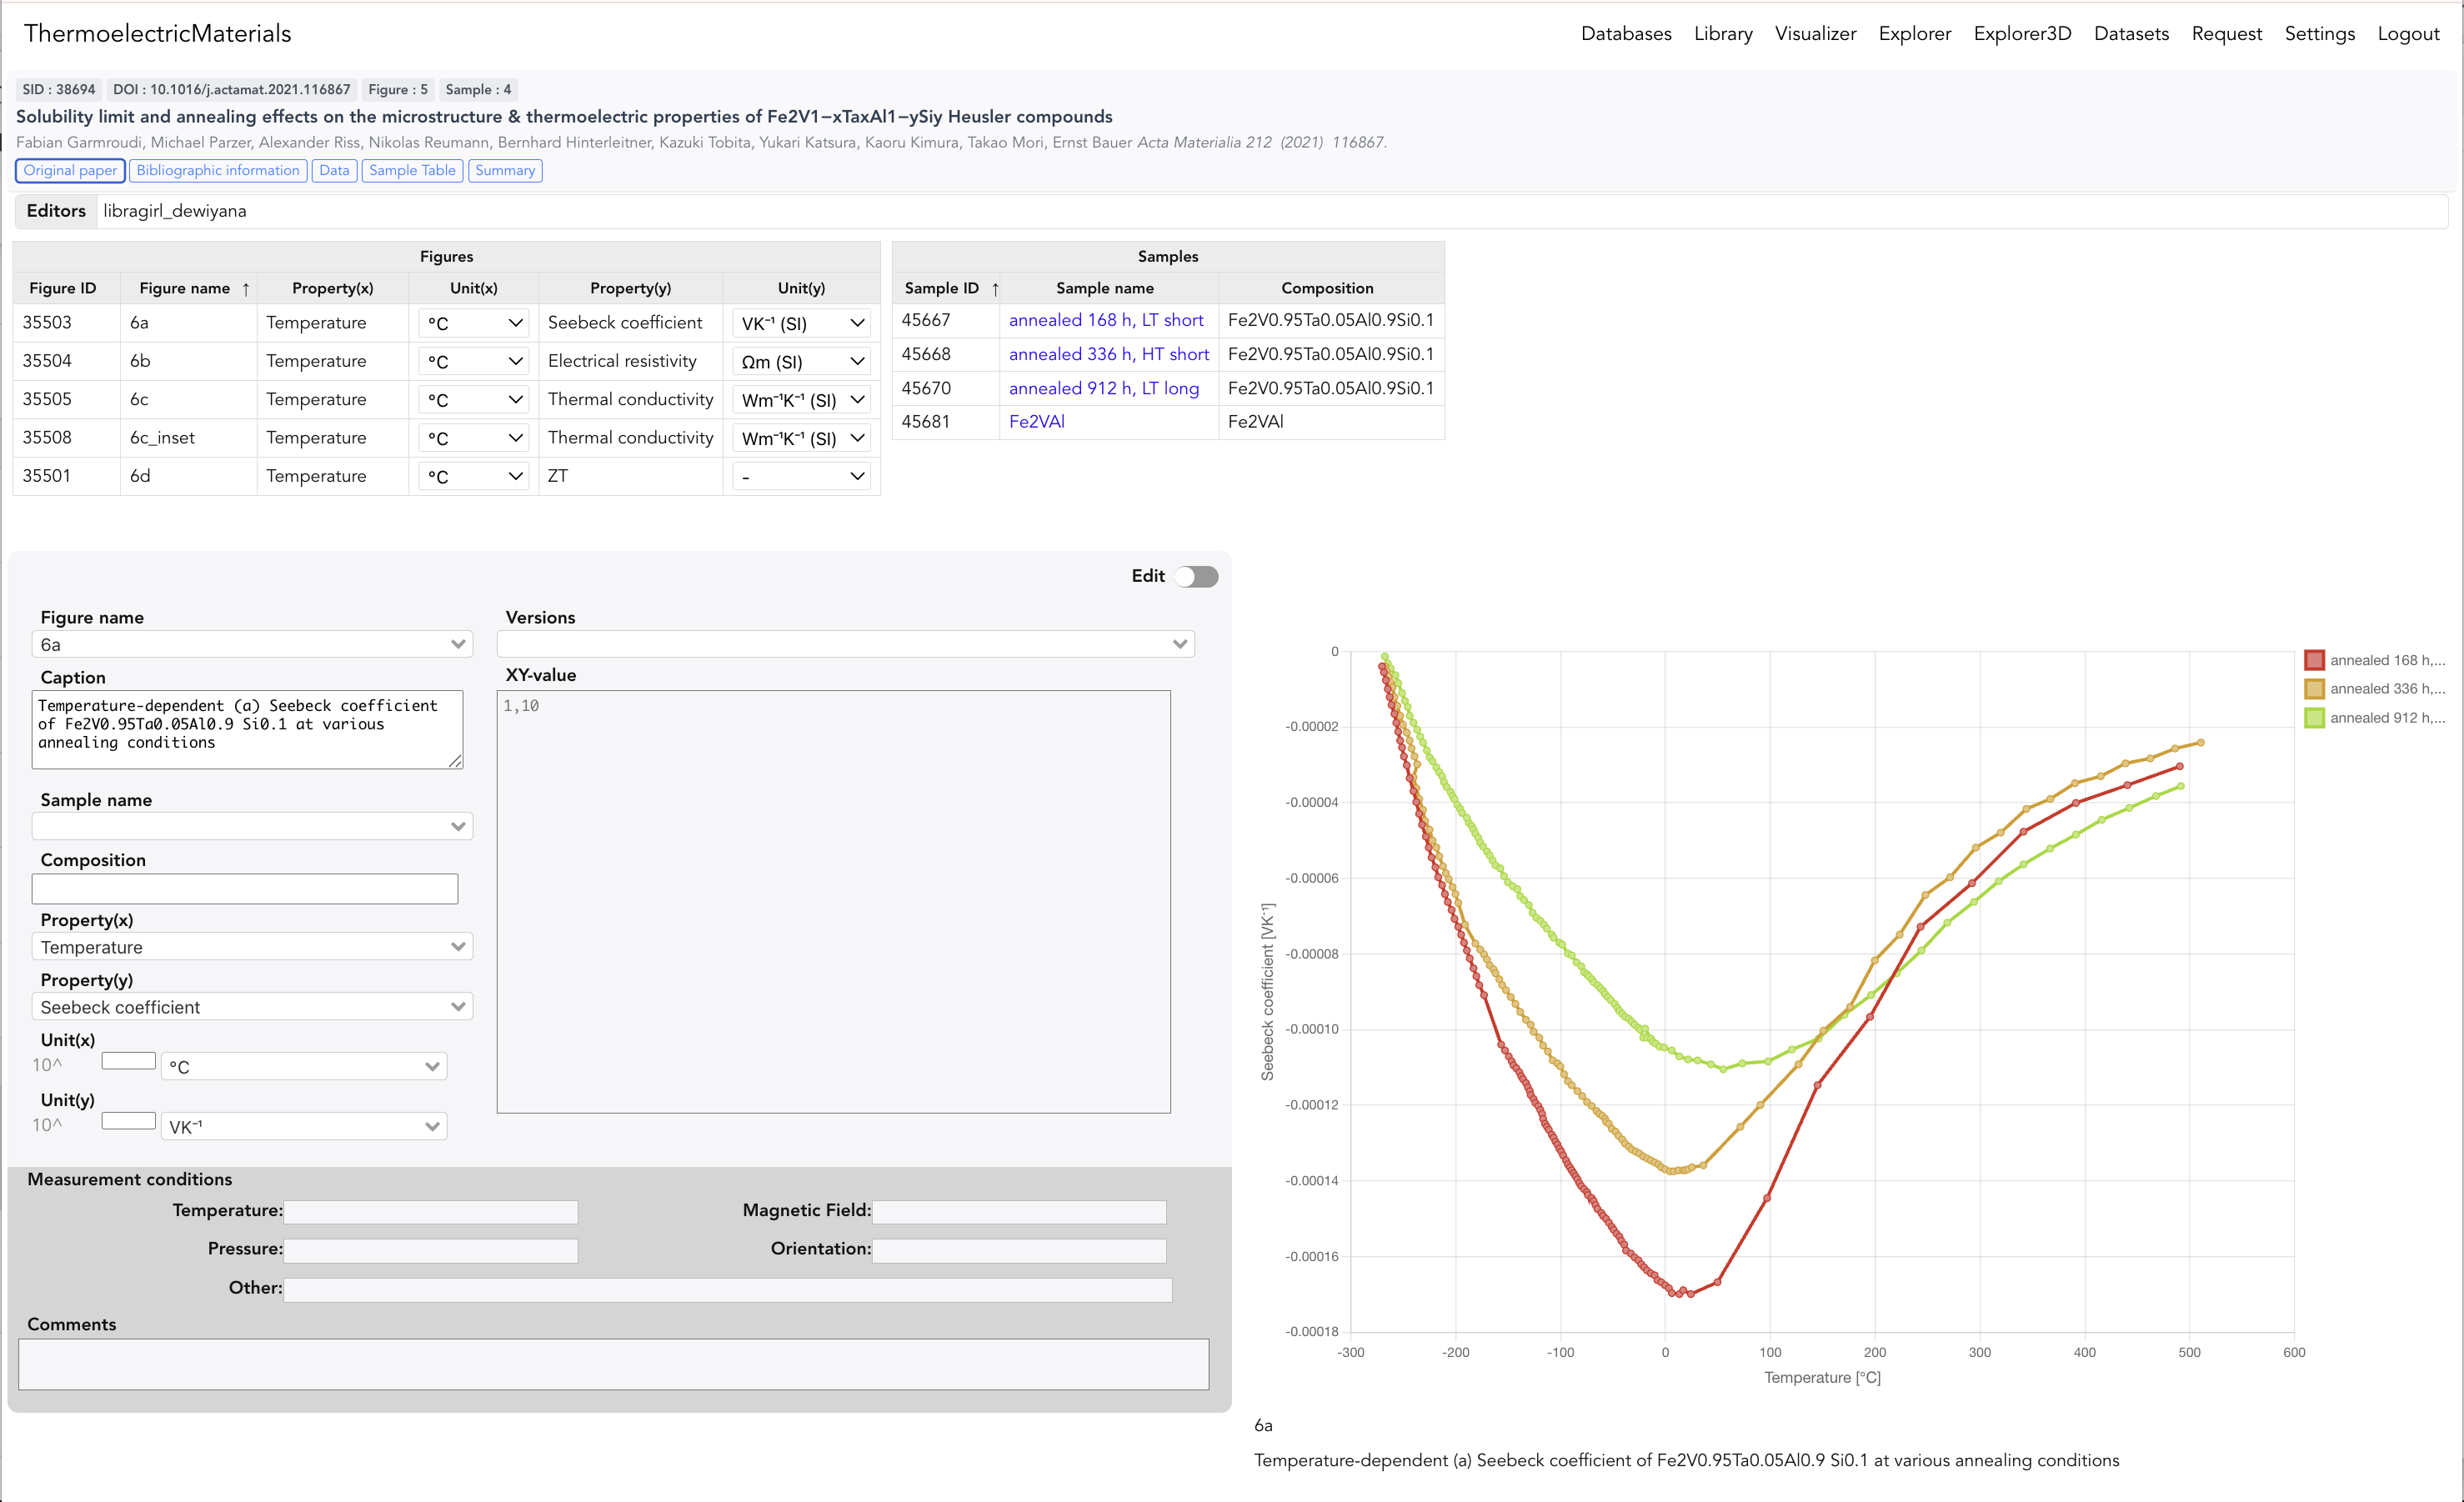
Click the Data link on a paper card to open the Data page. The Data page is structured as follows (Fig. 3-1):
- Header: Paper title, SID, DOI, number of Figures and Samples, links to Original paper / Bibliographic information / Data / Sample Table / Summary, etc.
- Editors: List of Curator usernames who have edited this paper
- Figures table: Figure ID / Figure name / Property(x), (y) / Unit(x), (y)
- Samples table: Sample ID / Sample name / Composition
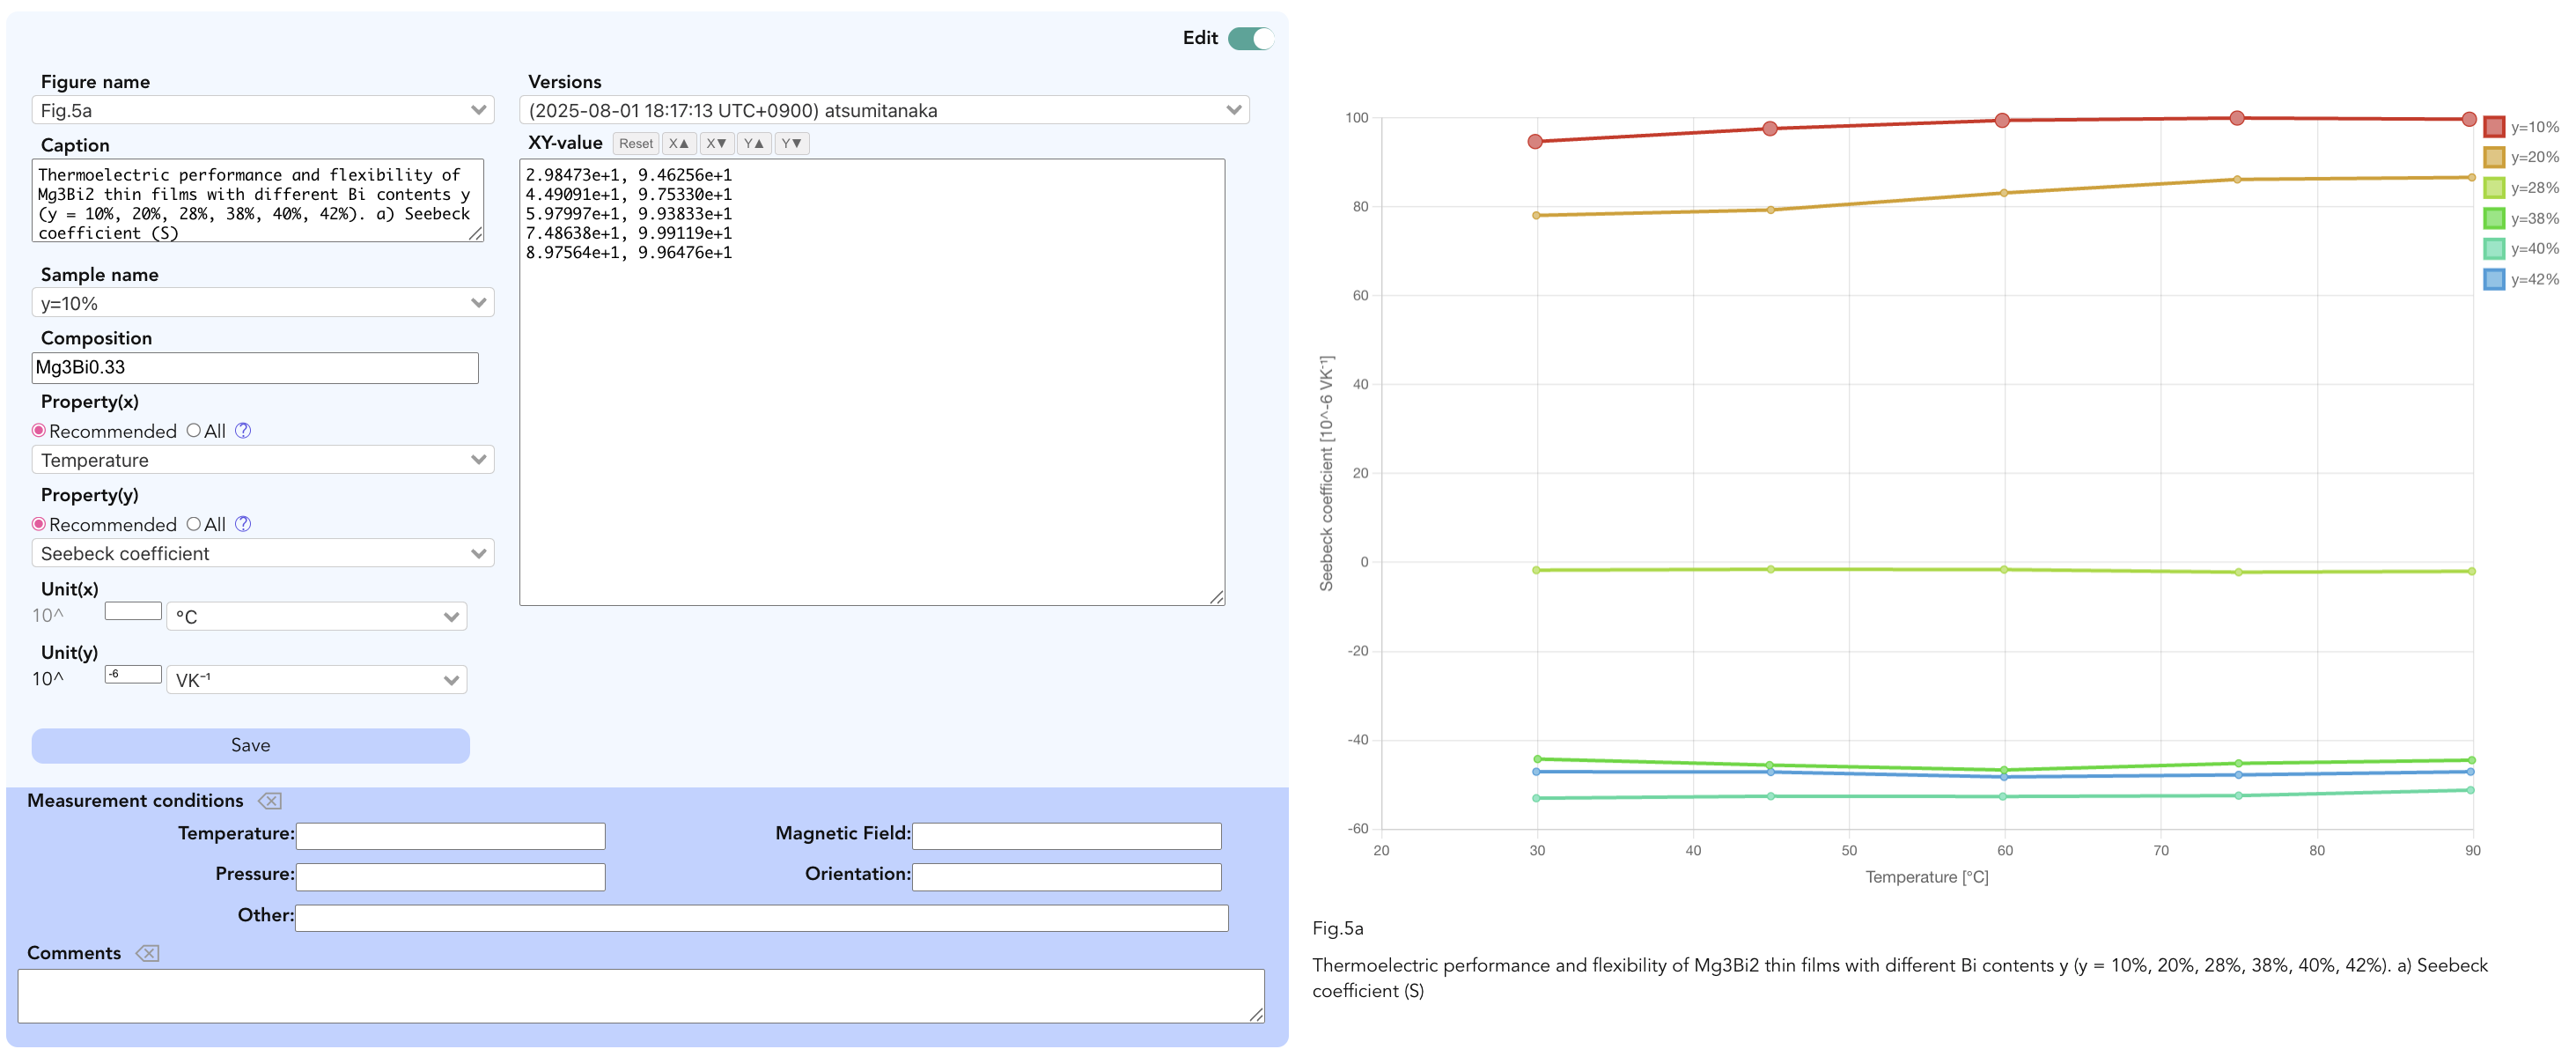
- Edit form (bottom left): Figure name / Caption / Sample name / Composition / Property(x), (y) / Unit(x), (y) / Measurement conditions / Comments / Save button
- XY-value (center): Area where you paste extracted numerical data
- Visualization plot (right): Plotly display of registered or currently entered data
3.4 Edit mode and creating Figures / Samples
Toggle Edit in the upper right to ON — the form background turns blue and editing is enabled.
- Figure name: Enter the same notation as in the paper (e.g.,
Fig 5a,4(a),S3) and press Enter to confirm. This field cannot be changed afterwards. - Caption: Copy and paste the figure caption from the paper.
- Prohibited characters:
<>"'&. - Special characters such as
Ωandµcannot be registered as-is — replace them with alphabetic equivalents (e.g.,ommega,mu).
- Prohibited characters:
- Sample name: Enter the name matching the plot legend (e.g.,
y=10%,1h BM-SPS) and press Enter to confirm. - Composition: Chemical composition formula (e.g.,
Mg3Bi0.33,Bi2Te2.85Se0.15). - Property(x), Property(y): Select the property from the dropdown. Toggle between Recommended (domain standard) and All (all options) using the radio buttons.
- Unit(x), Unit(y): Specify units in SI base + prefix/exponent notation (e.g.,
10^0×°C,10^0×VK^-1).
3.5 Extracting curves with StarryDigitizer
Launch StarryDigitizer from the right panel of the Data page (or a dedicated tab on the paper page). There are two tabs — WebPlotDigitizer and StarryDigitizer — and this manual covers the newer StarryDigitizer.
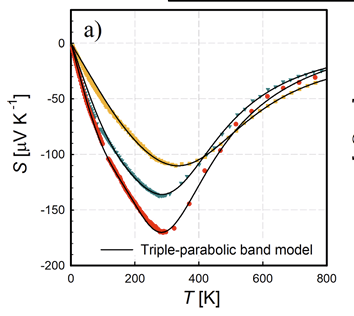
cmd+shift+4 / Win: win+shift+s).F. Garmroudi, M. Parzer, A. Riss, N. Reumann, B. Hinterleitner, K. Tobita, Y. Katsura, K. Kimura, T. Mori, E. Bauer, Solubility limit and annealing effects on the microstructure & thermoelectric properties of Fe2V1−xTaxAl1−ySiy Heusler compounds, Acta Materialia 212 (2021) 116867. DOI: 10.1016/j.actamat.2021.116867
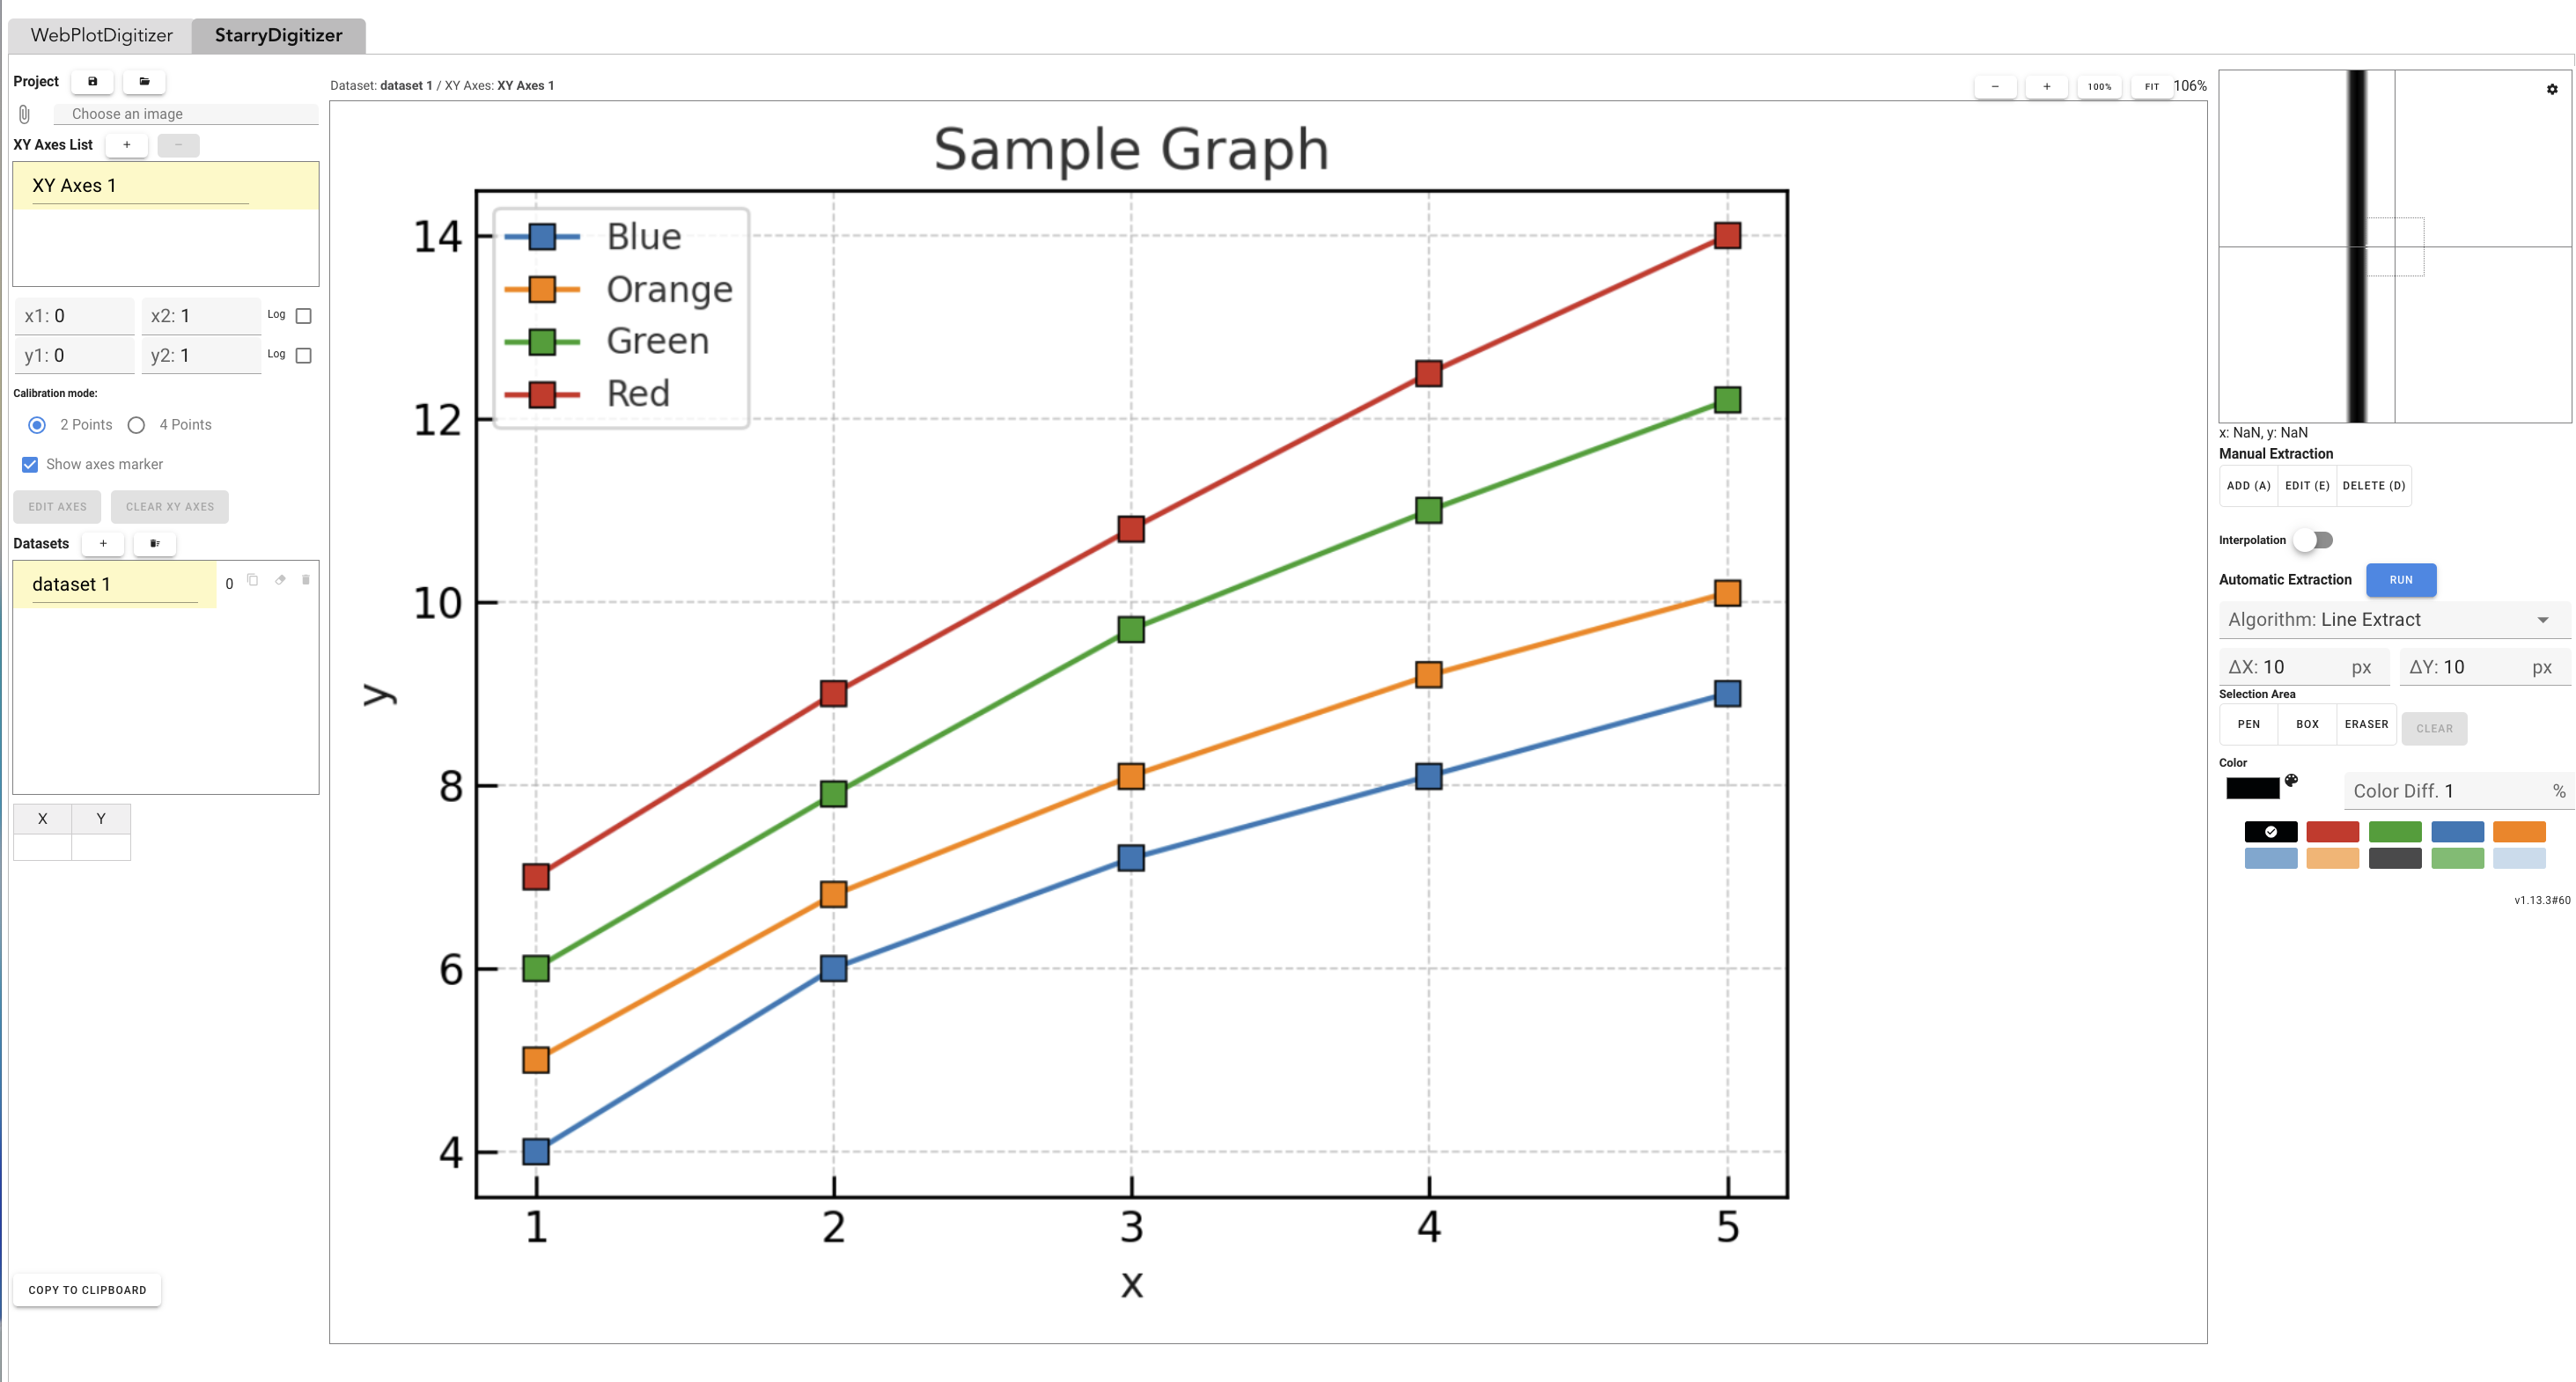
XY Axes 1 is created automatically in the XY Axes List.3.5.1 Axis calibration (Set Axes)
- Enter the known coordinate values for two points each on the x and y axes in the x1 / x2 / y1 / y2 input fields in the left sidebar (e.g.,
x1=30,x2=90,y1=-60,y2=120). - For logarithmic axes, enable the Log checkbox.
- Choose 2 Points / 4 Points in Calibration mode and keep Show axis marker ON to confirm positions visually.
- Click the corresponding positions on the plot, then click SET AXES to complete calibration. Click CLEAR XY AXES to start over.
3.5.2 Creating Datasets
- In the Datasets section of the left sidebar, click + to add as many Datasets as there are samples (e.g., 6 samples → datasets 1–6).
- With each Dataset selected, choose the matching series color from the Color palette on the right (match the legend colors).
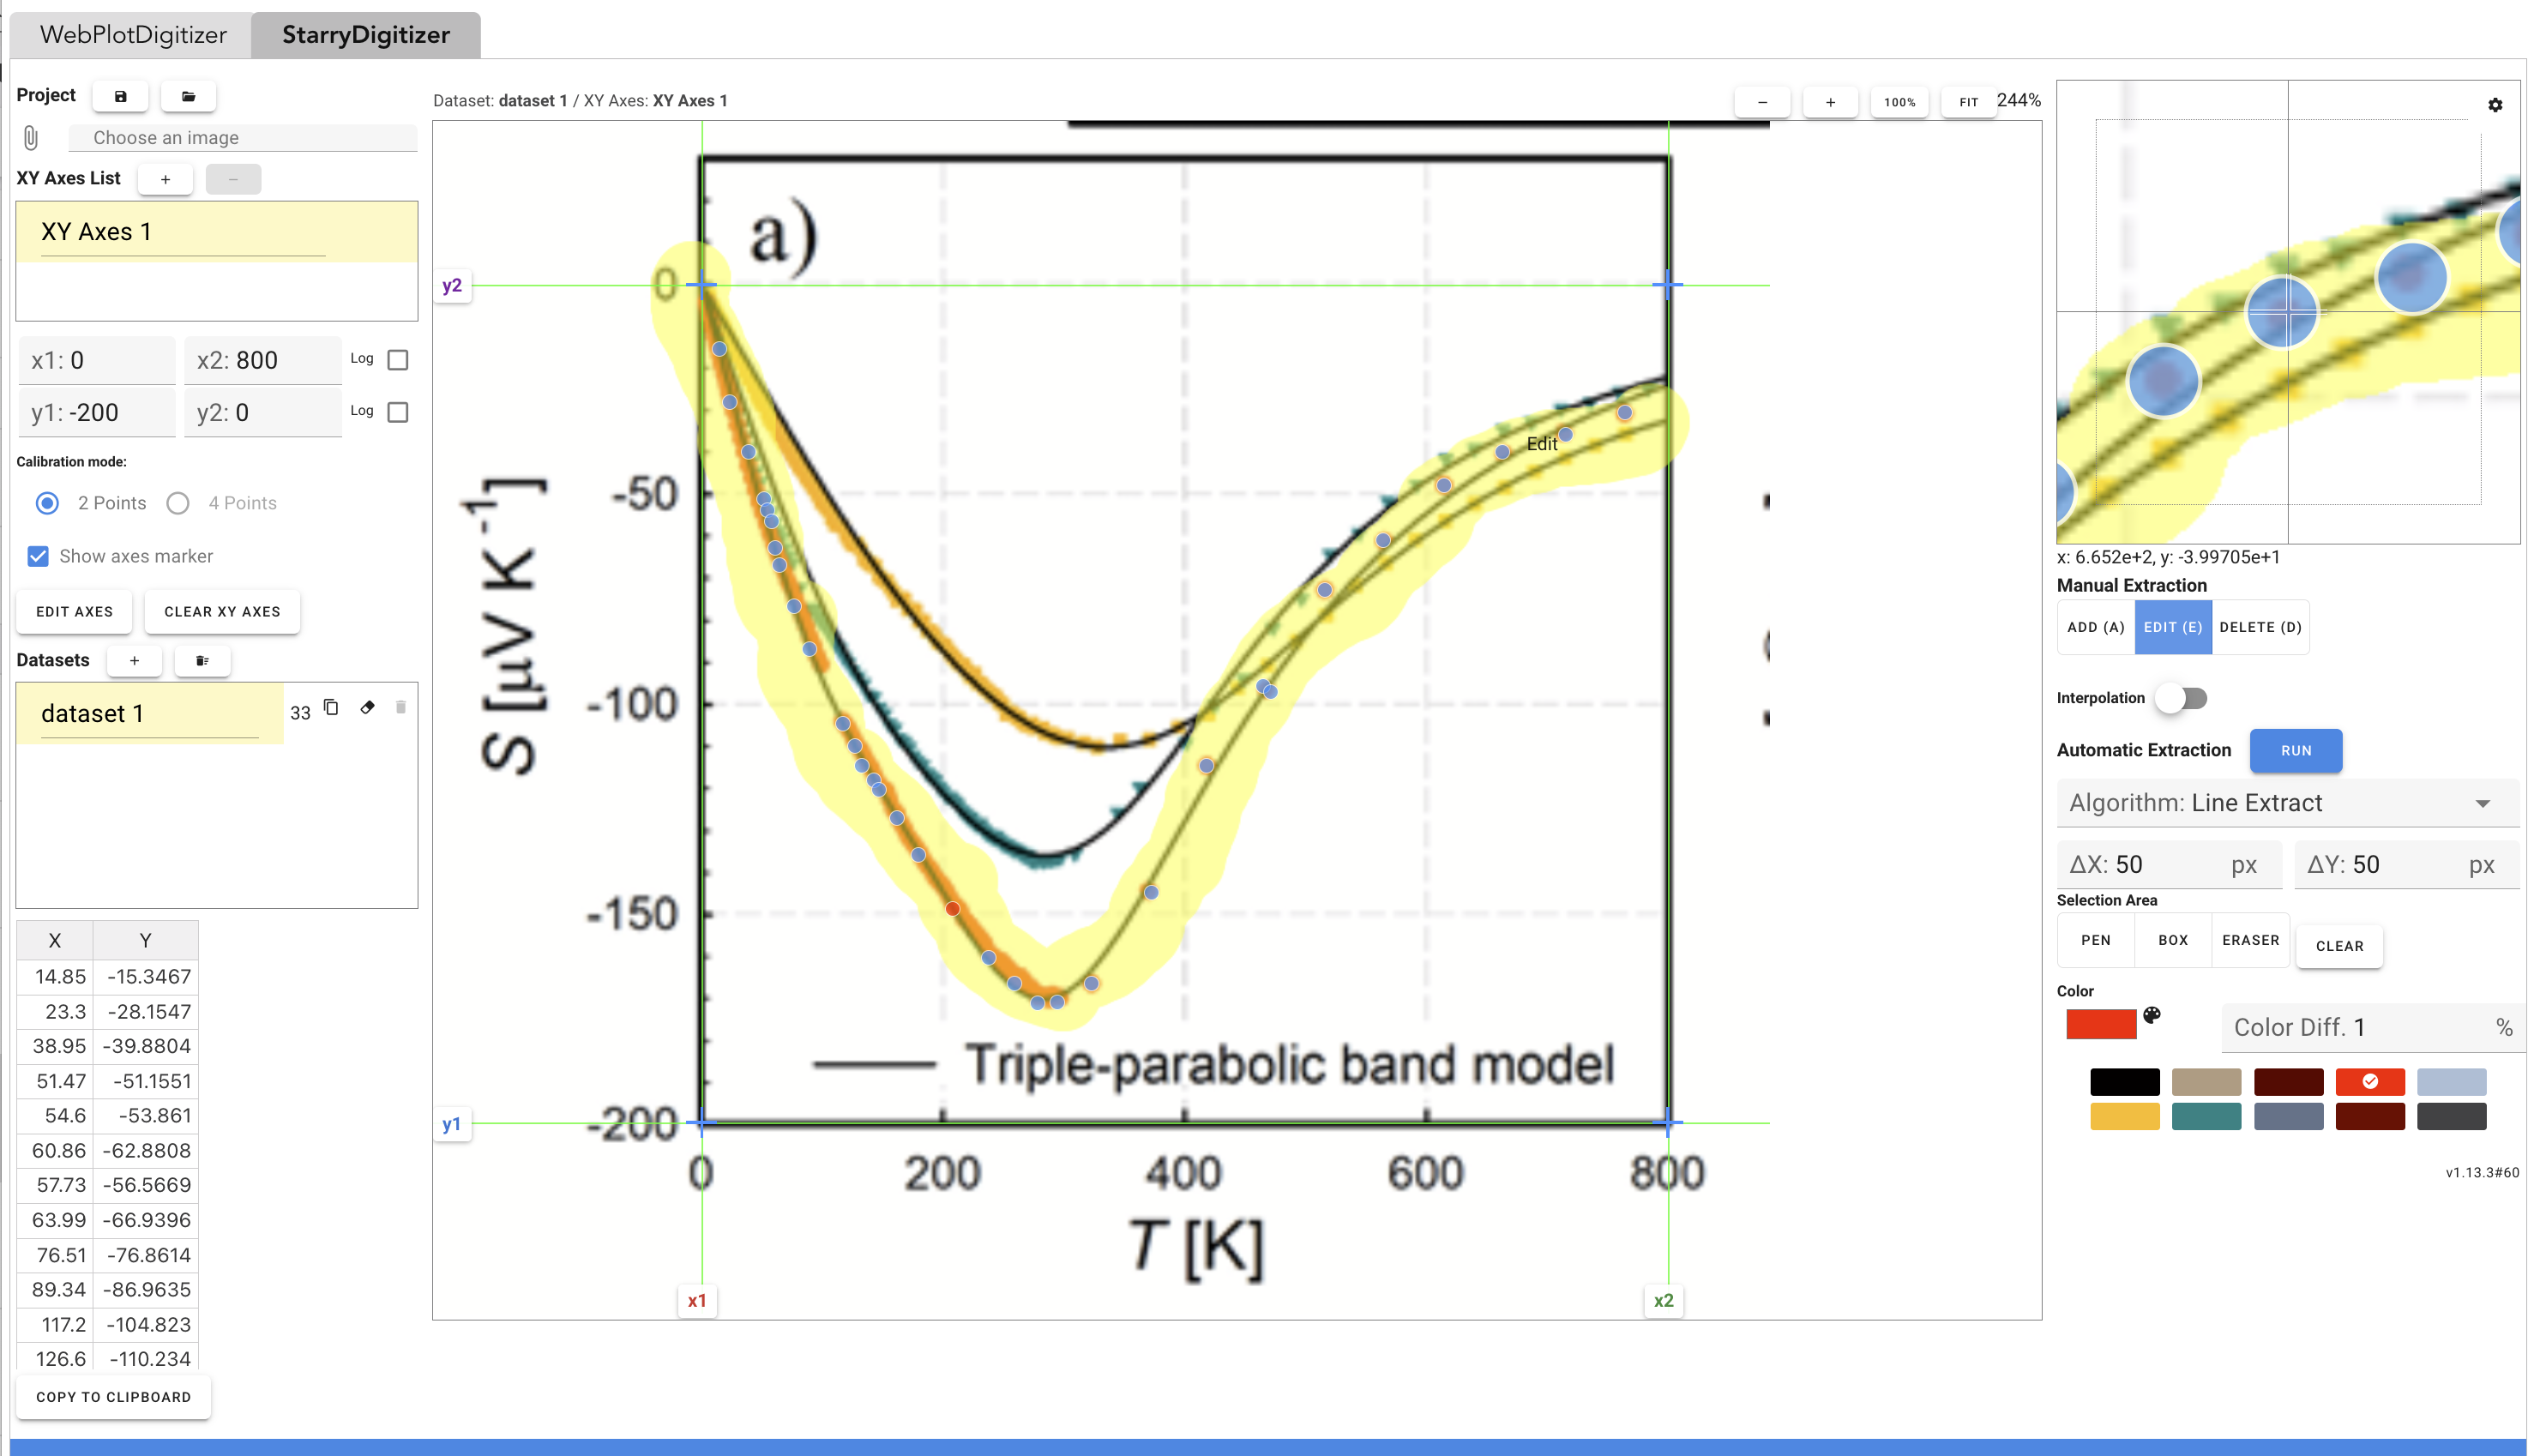
3.5.3 Extracting data points
The basic approach is to use the Automatic Extraction section in the right panel.
- Algorithm: Choose
Line Extract(for line plots) orAveraging Window(for scatter plots). - ΔX / ΔY: Specify the extraction interval (px). Use smaller values for dense points, larger for sparse.
- Restrict the extraction area with
PEN/BOXin Selection Area, then click RUN to auto-detect points. - Remove unwanted points with
ERASER, clear all withCLEAR. UseADD (A)/EDIT (E)/DELETE (D)in Manual Extraction to add or correct individual points. - Extracted points are immediately reflected in the X / Y table at the bottom left.
3.5.4 Copying to clipboard
Click the COPY TO CLIPBOARD button at the bottom left to copy the (X, Y) pairs of the selected Dataset to the clipboard as tab-delimited text.
3.6 Pasting into XY-value and saving
- Return to the Data page and enable Edit mode for the target Sample row.
- Click in the XY-value area in the center and paste with
Ctrl/Cmd + V. The right-side plot updates immediately, allowing you to compare with the original figure. - Confirm that all required fields are filled (Figure name / Sample name / Composition / Property / Unit).
- Click Save to complete registration. New rows will appear in the Figures / Samples tables.
3.7 Editing existing data
Anyone can edit and correct data registered by other users. This is the core of Starrydata2's collaborative data curation.
- Click a Sample row to load it into the edit form.
- Enable the Edit toggle in the upper right and make changes (redo XY-value, correct composition, delete erroneous points, etc.).
- Click Save to confirm. Your Username will be appended to the Editors table.
3.8 Best practices for registration
- Figure name must strictly follow the paper's notation (e.g.,
Fig 5a,4(a),S3). - Sample name should match the plot legend exactly (e.g.,
y=10%,1h BM-SPS). This prevents the accidental loss of sample identification if the composition alone is ambiguous. - Even within the same figure, curves with different x-axis properties (e.g., temperature dependence vs. carrier concentration dependence) should be registered as separate Figures.
- Be careful of prohibited characters
< > " ' &and special characters such asΩ µ(→ useommega/mu). - If you plan to curate actively for more than a month, contact the Starrydata team to be introduced to the question channel (inquire via Contact).
Next steps
- Verify the data you registered → Chapter 2: Search & Browse
- Export registered data for analysis → Chapter 4: Download
Reference
- Official tutorial: https://starrydata.org/tutorial/01.html (full procedure using thermoelectric materials as an example)